
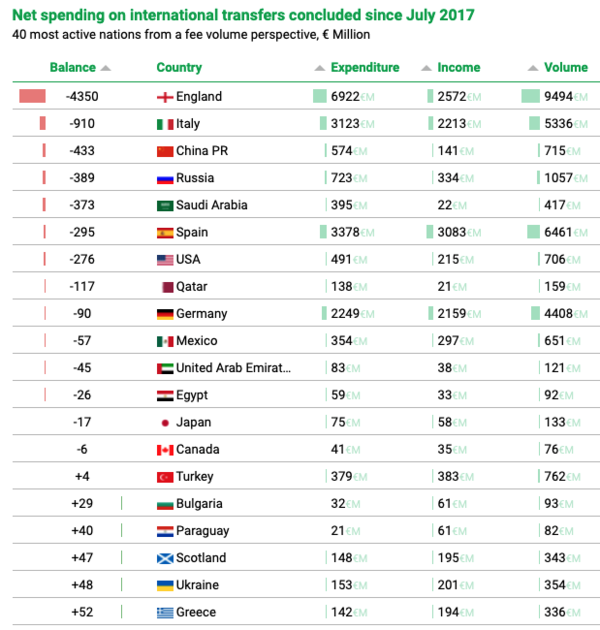
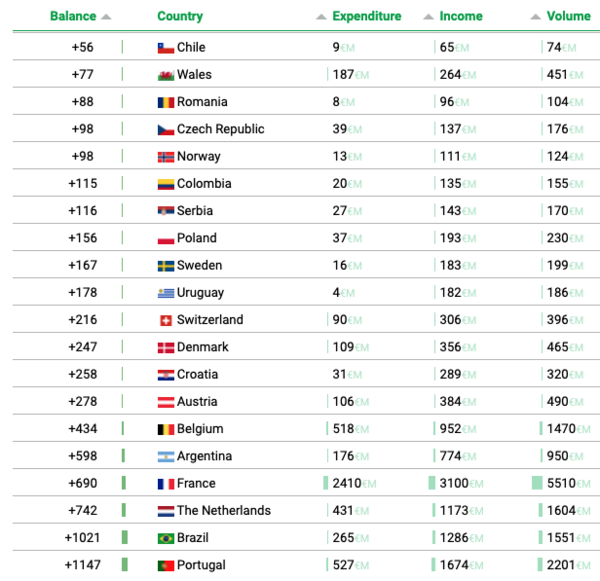
CIES Football Observatory Weekly Post presents the net spending on international transfers concluded since July 2017 by clubs of the 40 most active nations from an incoming and outcoming fee volume perspective. England (- €4.35 billion) and Portugal (+€1.15 billion) recorded the most negative and, respectively, positive trade balances.
Italy has the second most negative trade balance on international transfers concluded since the start of the 2017/18 season (-€910 million), followed by China, Russia, Saudi Arabia and Spain. At the opposite end of the table, Brazil (+€1.02 billion) is just behind Portugal and outranks the Netherlands, France, Argentina and Belgium.

The data includes eventual add-ons irrespective of their effective payment, as well as sell-on percentages. However, this information, such as that on transfer fees themselves, is not always available. The figures presented are thus to be considered approximations that are as accurate as possible. FIFA’s annual reports with official aggregated data are available for free here.
관련기사
- Confirmed: Tottenham and Mallorca will clash in Daegu in July
- Chelsea at risk of losing sponsorship from Asian company
- Fulham is paying attention to Son Jun-ho
- New Plan : Chinese Super League
- Port FC : We are ready to beat Ulsan
- Korean Legend has been appointed as 'K-League Ambassador'
- Gangwon's Serbia-Montenegro national striker suffered serious injuries